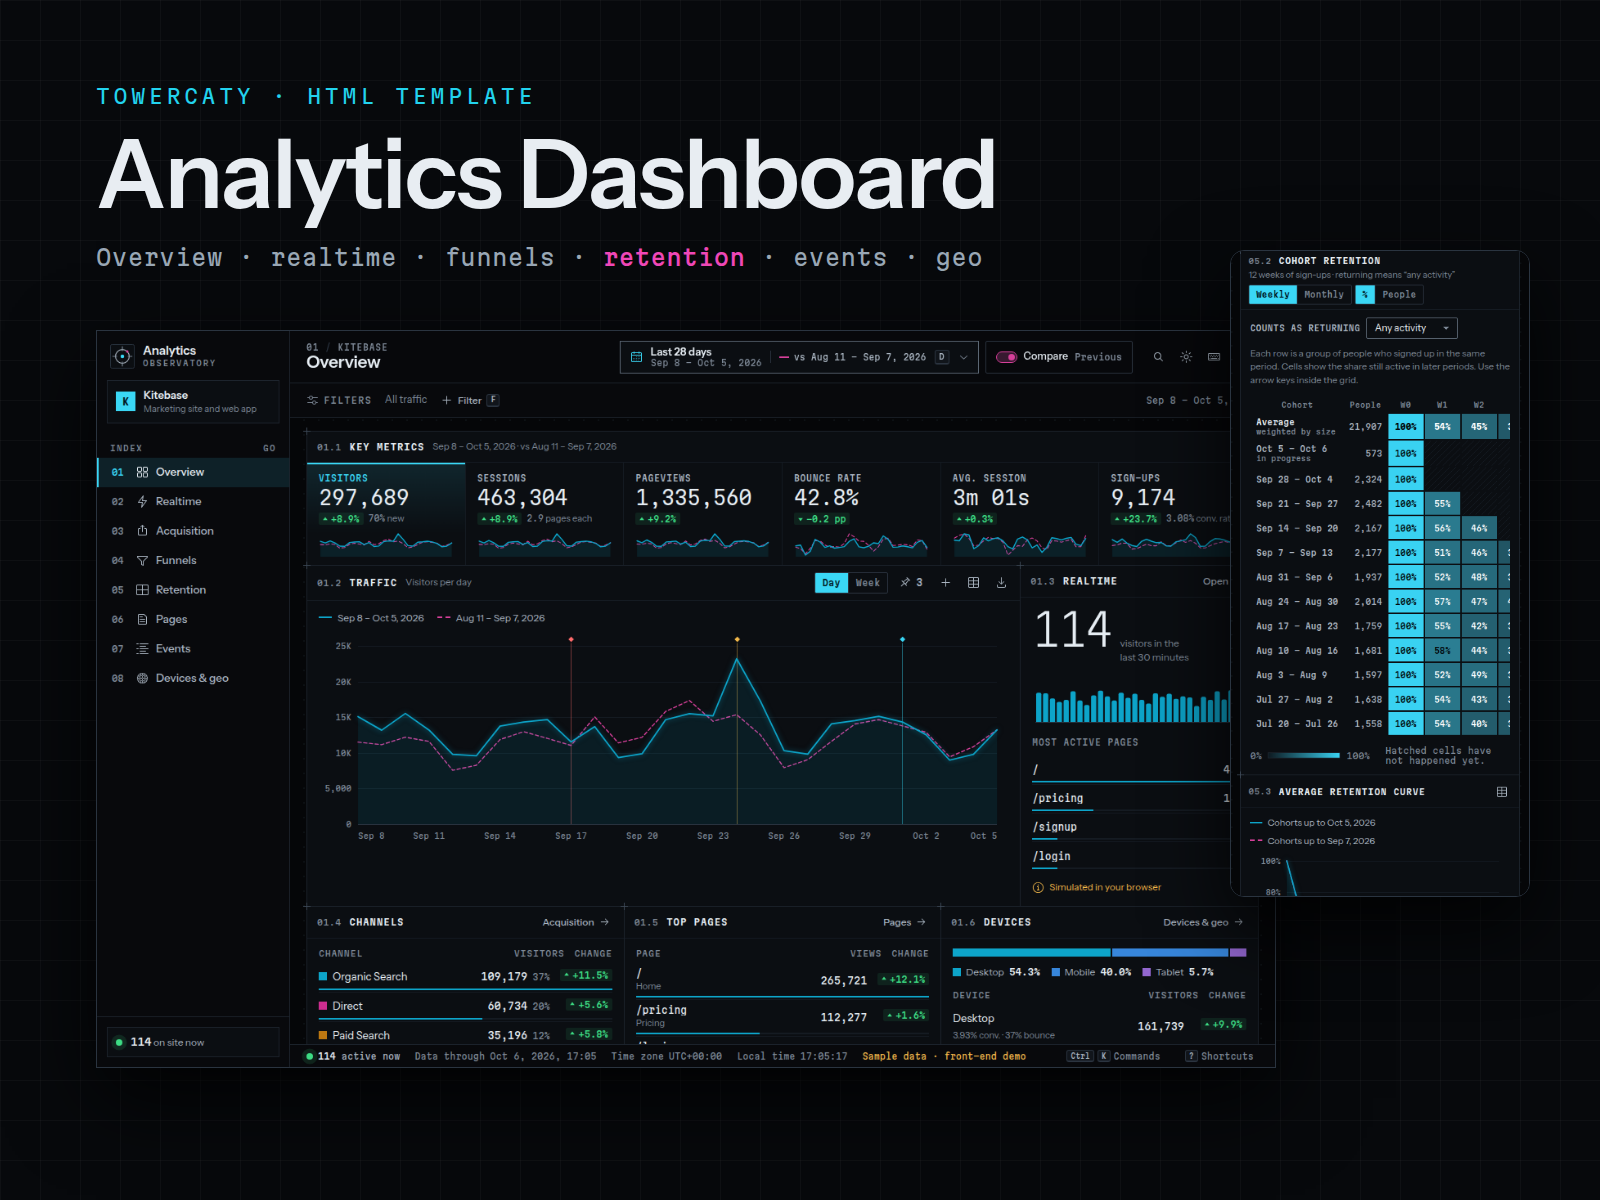
Analytics Dashboard
From $39.00
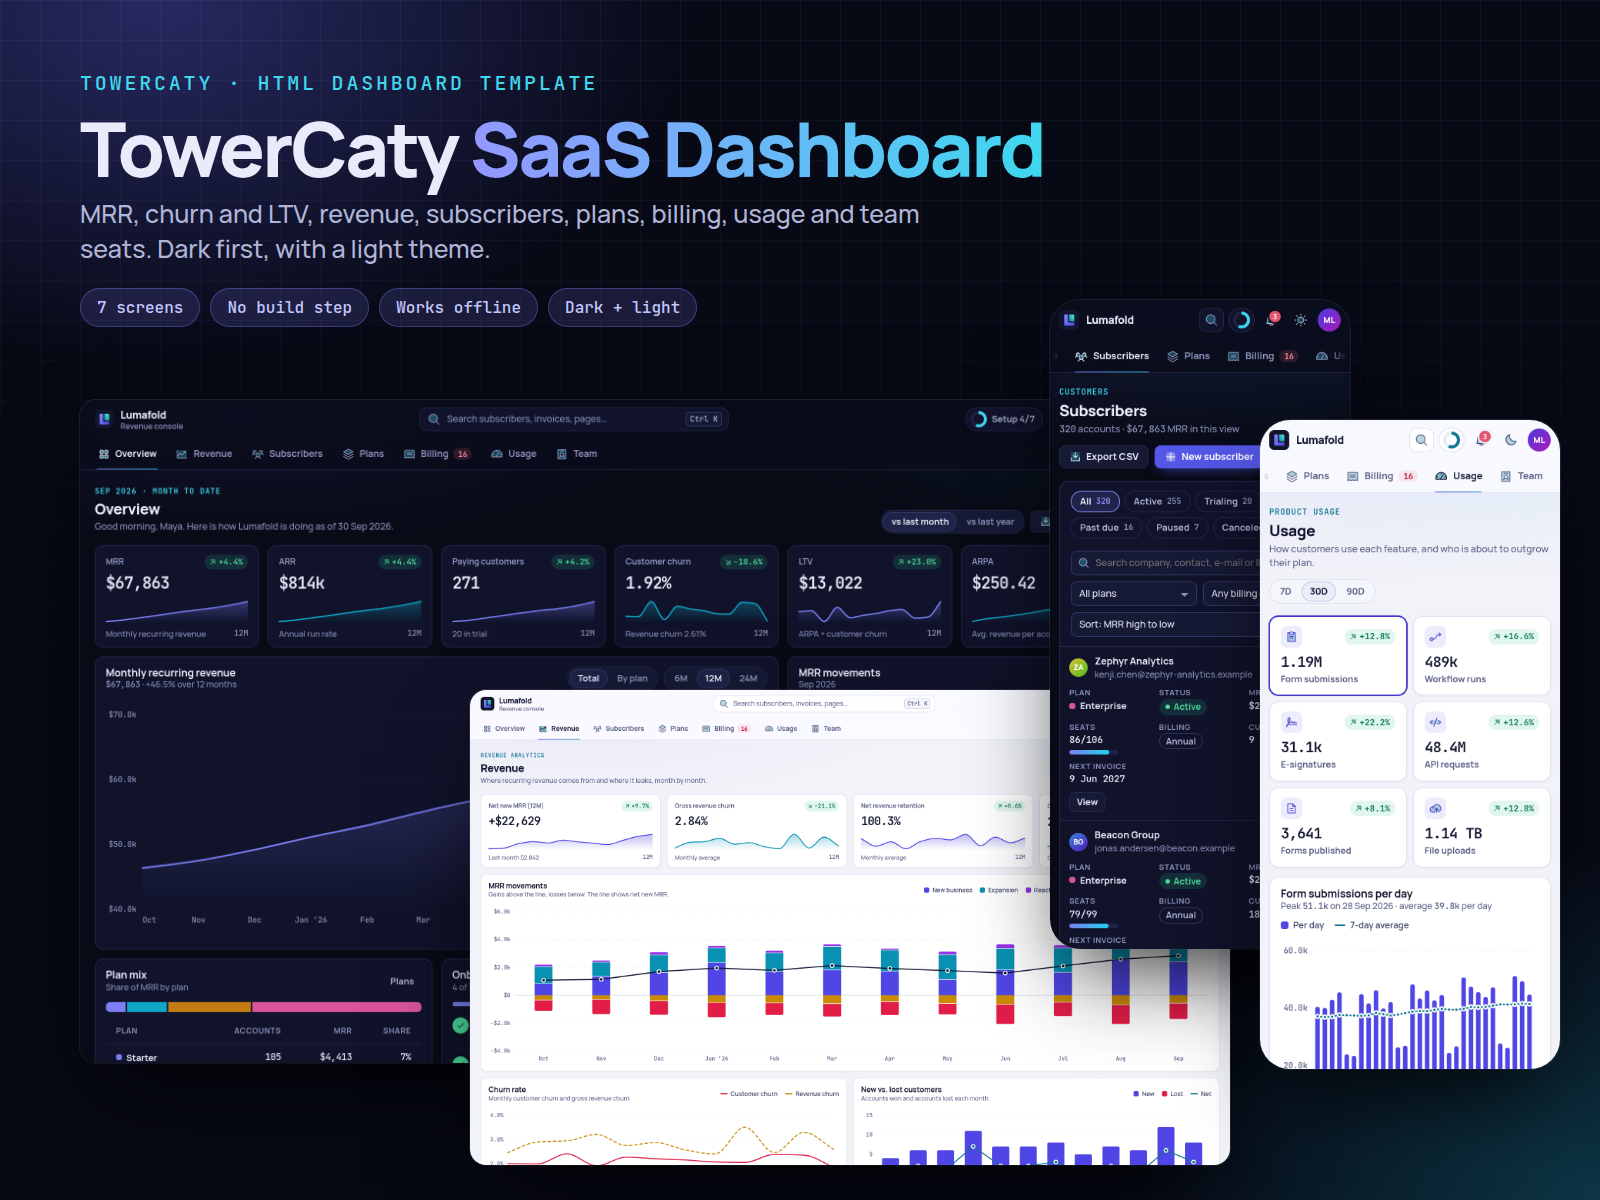
Dark, data-dense web analytics dashboard template in plain HTML, CSS and JavaScript: eight reports, date range picker with comparison, funnels, cohort retention heatmap, events explorer and keyboard shortcuts. Runs on simulated sample data.
- Secure payment via PayPal
- Instant digital delivery
- Clear licensing
- Support available
Overview
A dark "observatory" style analytics dashboard template for product and web analytics. It is built with plain HTML, CSS and vanilla JavaScript, with no framework and no build step.
This is a front-end template with simulated sample data. It does not track visitors, collect data or connect to any server. There is no backend, no tracking script, no login and no email. All numbers are fictional and generated in the browser. The "realtime visitors" counter and live event stream are simulated locally and are not live traffic. The forms (annotations, saved funnels, property filters) do not send anything; they save only to your browser's localStorage. You can connect your own data source through one Promise-based data layer (AD.api).
Reports
- Overview: six key metrics with sparklines, traffic over time with comparison and annotations, channels, top pages, devices, funnel, retention and a countries map
- Realtime (simulated): visitors in the last 30 minutes, pageviews per minute, active-visitor map and event stream, with pause
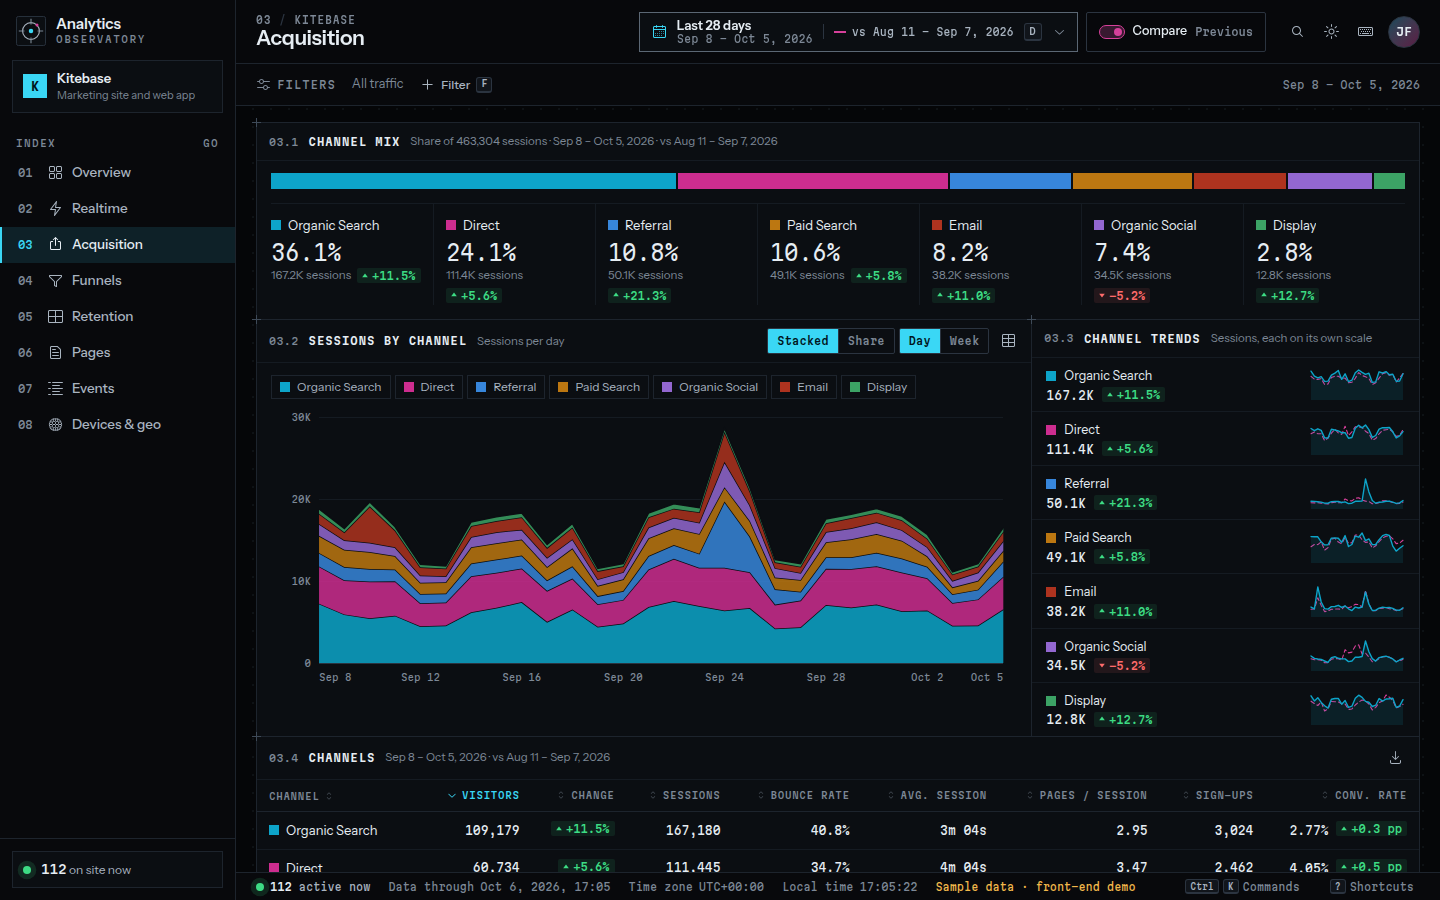
- Acquisition: channel mix, stacked or share chart, small multiples, channels, sources and campaigns
- Funnels: built-in funnels plus a funnel builder, step conversion and drop-off, segments and time to convert
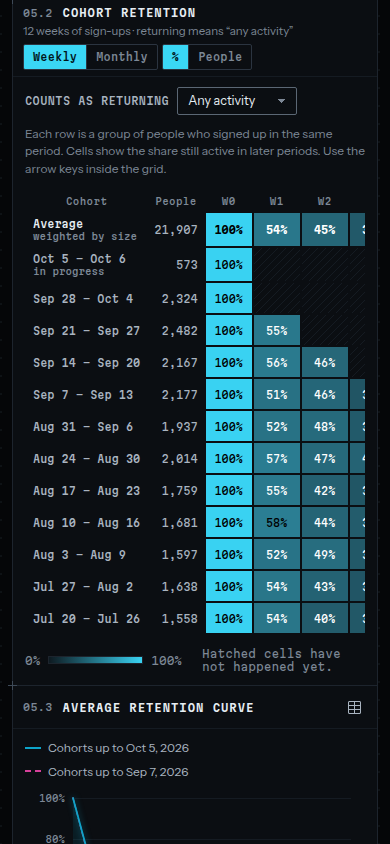
- Retention: weekly or monthly cohort heatmap, average retention curve and cohort sizes
- Pages: all, entry and exit pages with a page detail drawer
- Events: event types, volume, a filterable event stream and an event detail drawer
- Devices & geo: world map, countries, devices, operating systems, browsers, cities and screen widths
Design
Near-black panels with thin 1px borders, electric cyan and magenta series, tabular monospace numbers and a dense grid of small panels. It also has a light theme and is responsive from phones to wide desktops.
What's included
- Complete product files (ZIP)
Languages
The product description and details are provided in these languages.
Features
- Eight report pages: overview, realtime, acquisition, funnels, retention, pages, events, devices & geo
- Date range picker with nine presets, two-month calendar, typed dates and validation
- Comparison with the previous period, the same period last year or a custom period
- Realtime visitors counter, minute bars, map and event stream, simulated locally in the browser
- Acquisition channels with mix meter, stacked/share chart, small multiples, sources and campaigns
- Funnel chart with drop-off, comparison and a funnel builder (saved in localStorage)
- Cohort retention heatmap (weekly/monthly, % or people) with keyboard navigation
- Top, entry and exit pages with search, sorting, pagination and a detail drawer
- Events explorer with search, property filters, user filter, paging and a JSON detail view
- Device, OS, browser, screen width, country and city breakdowns with a dot-matrix world map
- Filters by channel, device and country, shown as chips and kept in the URL
- Command palette (Ctrl/Cmd K) and keyboard shortcuts, including G-then-letter navigation
- Chart annotations (release, campaign, incident, other) saved in the browser
- Table view for every chart and CSV download for every table
- Dark and light themes, remembered per browser
- Responsive layout from 390 px phones to wide desktops
- Accessibility basics: landmarks, labelled controls, visible focus, AA contrast, reduced motion
- Deterministic simulated sample data and a Promise-based data layer to connect your own source
- No build step: works by opening index.html or from any static host
- Bundled open-licensed fonts (Instrument Sans, Martian Mono) and icons; no external requests
Requirements
A current web browser (Chrome, Edge, Firefox or Safari, 2023 or newer). No server, build tools, Node.js or package manager are needed. Optional: any static web host. Front-end only, with simulated sample data. Connecting real analytics data requires your own backend or API.
Compatibility
Static HTML5, CSS and vanilla JavaScript (classic scripts, no modules). Runs from file:// and from any static host (Netlify, Vercel, Cloudflare Pages, GitHub Pages, S3, Apache, Nginx). Responsive from 390 px to wide desktop screens. Automated tests were run in Chromium, and the dashboard was also checked in Firefox and Safari's WebKit engine.
Installation
- Download and unzip
analytics-dashboard-1.0.0.zip. - Open the
analytics-dashboardfolder and double-clickindex.html. The dashboard opens with sample data. - Optional: serve the folder from any static server, for example
python3 -m http.server 8080inside the folder, then openhttp://localhost:8080. - To publish it, upload the folder to any static host. No server-side code or environment variables are needed.
See README.md in the package for full details.
User guide
All data is simulated sample data. Nothing is tracked, collected or sent, and the realtime counter is simulated in your browser.
- Change the period: click the date range at the top or press D. Pick a preset (keys 1–9), click two days in the calendar or type start and end dates. Turn comparison on or off with C.
- Filter: press F or click Filter to filter by channel, device or country. Remove a chip to clear it, or press X to clear all.
- Navigate: use the sidebar, the command palette (Ctrl K / ⌘ K) or G followed by a letter (O, R, A, F, C, P, E, D). Press ? for every shortcut.
- Read charts: hover or focus a chart for tooltips. The table button shows the same data as a table, and the download button saves a CSV.
- Annotations and funnels: add annotations with N and build funnels in Funnels → New funnel. These forms do not send anything; they are saved in your browser only.
- Theme: press T to switch between dark and light.
- Customize: edit
assets/js/config.jsfor names and defaults, and the CSS variables at the top ofassets/css/app.cssfor colors. - Connect your data: replace the methods of
AD.apiinassets/js/data.jswith calls to your own API. Each method returns a Promise. - Reset: Account menu → Reset demo data clears saved settings.
License
| Personal$39.00 | Commercial$49.00 | Extended$199.00 | |
|---|---|---|---|
| Projects | 1 | 5 | Unlimited |
| Users or sites | 1 | 1 | 5 |
| Commercial use | Not allowed | Allowed | Allowed |
| Modification | Allowed | Allowed | Allowed |
| Resale | Not allowed | Not allowed | Not allowed |
| Redistribution | Not allowed | Not allowed | Not allowed |
| Updates | 12 months | 12 months | Lifetime |
| Support period | 6 months | 12 months | 12 months |
| License key | Yes | Yes | Yes |
Pay with PayPal or a debit or credit card. We send your product once the payment is confirmed.
Support & Updates
Support from TowerCaty for questions about installing and customizing the template. Contact us through the details in your order email or on this product page, and include the product name, version, browser and a screenshot. Building a backend or connecting a specific analytics service is not included.
Changelog
1.0.0
- Version 1.0.0: first release in the store.
Last Updated
- Last update
- Oct 6, 2026
- Version
- 1.0.0